Smoothed Source Weighted EMAThe Smoothed Source EMA is a tool designed to help traders identify potential buying and selling opportunities in the market. It combines two key elements: price smoothing (using standard deviation) and an Exponential Moving Average (EMA). The purpose is to filter out the day-to-day price fluctuations and create clearer buy and sell signals.
Key Concepts Behind the Indicator:
Price Smoothing (Standard Deviation):
To make the price action easier to follow, the indicator first "smooths" the price. This is done by looking at how much the price tends to move up and down (known as standard deviation).
It then creates two "bands" around the current price—one above and one below. These bands represent a smoothed version of the price and help filter out the noise caused by small, random price movements.
Exponential Moving Average (EMA):
The indicator also uses an Exponential Moving Average (EMA), which is a line that represents the average price over a certain period of time (but gives more weight to recent prices). The EMA helps capture the general trend of the price.
The indicator uses this EMA to compare the current price with the overall trend.
How Does the Indicator Work?
Once the indicator calculates the smoothed price bands and the EMA, it looks for specific conditions to trigger a buy or sell signal:
Long (Buy) Signal:
A buy signal happens when the smoothed price (the lower band) is above the EMA. In simple terms, the price is moving up, and the indicator is telling you it's a good time to buy.
The more "weight" or influence you give to the EMA, the slower this buy signal will appear, meaning it’ll only trigger when there’s a strong enough upward movement.
Short (Sell) Signal:
A sell signal occurs when the smoothed price (the upper band) is below the EMA. This suggests the price is moving down, and the indicator signals that it might be time to sell.
Again, the more "weight" you put on the EMA, the slower the sell signal will appear, as the indicator waits for a clearer downtrend.
Why is this Useful for Traders?
Smoothing the Price: Many traders struggle with the noise of price fluctuations, where the price moves up and down quickly without a clear trend. By smoothing the price, this indicator helps traders focus on the bigger picture and avoid reacting to every small movement.
Clear Buy and Sell Signals: The indicator generates easy-to-understand buy and sell signals based on the relationship between the smoothed price and the EMA. If the price is above the smoothed level and EMA, it’s a signal to buy. If it’s below, it’s a signal to sell.
Customizable Sensitivity: The indicator lets traders adjust how sensitive the buy and sell signals are. By changing certain settings, such as the smoothing length and the weight of the EMA, traders can make the indicator react faster or slower depending on how quickly they want to catch changes in the market.
How the Indicator Appears on the Chart:
EMA Line: A line that represents the trend of the price.
Upper and Lower Smoothed Bands: Two bands above and below the price that help identify when the price is moving up or down relative to the trend.
Buy and Sell Arrows: Small arrows on the chart show where the indicator suggests buying or selling.
Colored Bars: The bars on the chart may change color to visually indicate whether the indicator suggests a buy (green) or a sell (red).
In Summary:
The Smoothed Source EMA helps you identify trends by smoothing out price movements using standard deviation, then comparing these smoothed prices with the Exponential Moving Average (EMA).
When the smoothed price moves above or below the EMA, it gives you a signal: a buy when the smoothed price is above the EMA, and a sell when it’s below.
You can adjust how quickly or slowly these signals appear by modifying the settings, giving you control over how sensitive the indicator is to changes in the market.
This indicator is useful for traders who want to reduce noise and focus on the overall trend, using clear, visually simple signals to guide their trading decisions.
Cerca negli script per "3 ema"

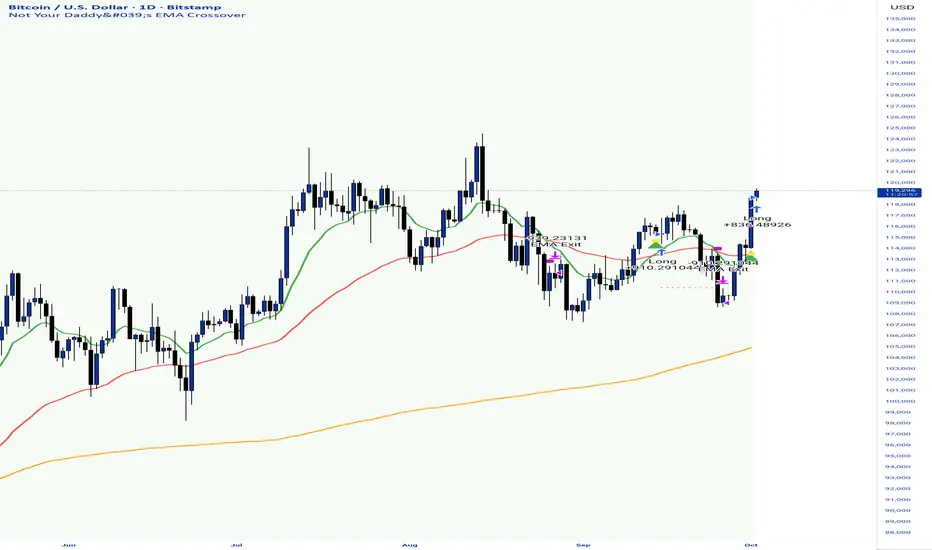
Not Your Daddy's EMA CrossoverNot Your Daddy's EMA Crossover - Quick Guide
What It Does
This isn't your typical 50/200 EMA crossover. It uses academically-proven, optimized EMA periods specifically backtested for crypto markets. Instead of generic settings, it adapts to different trading styles with research-backed parameter combinations that have demonstrated real returns.
Core Logic
Enters when fast EMA crosses slow EMA in the trend direction (confirmed by 200 SMA filter)
Exits either on opposite EMA cross (trend-following) or at fixed profit targets (scalping)
Uses a 200 SMA to filter trades - only longs above it, only shorts below it
Key Settings & Toggles
1. Trading Style (Auto-adjusts EMA periods):
"15 Min Scalping": 9/21 EMA - Fast-paced, frequent signals
"1 Hour Swing": 13/48 EMA - For swing trading
"Daily Trend": 15/150 MA - Captured +97.87% in bull runs
2. Entry Method:
"Crossover Entry": Enters immediately on EMA cross
"Pullback to EMA Entry": Waits for first pullback to slow EMA (better risk/reward)
3. Exit Method:
"EMA Cross Exit": Trend-following, lets winners run until EMAs reverse
"Fixed % Target (Scalping)": Quick 0.5-1% profits with tight stops
4. Optional Features:
MACD Confirmation: Adds 6-15-1 MACD filter for higher-probability setups
Periodic Compounding: Compounds every 30 hours (research shows 1-30 hour compounding is optimal)
Recommended Timeframes
📊 Match your chart to your selection:
Select "15 Min Scalping" → Use 15-minute chart
Select "1 Hour Swing" → Use 1-hour chart
Select "Daily Trend" → Use daily chart
I personally like this on the daily, which coincidentally is printing a long signal today on Bitcoin.
Enjoy!
EMA Cross By Crypto collective Xეს ინდიკატორი გაძლევთ საშუალებას ნახოთ ყველაზე პოპულარული EMA წყვილები ერთ გრაფიკზე:
EMA 9/21
EMA 20/50
EMA 50/200
EMA 100/200
და საკუთარი, მომხმარებლის მიერ შერჩეული Custom წყვილი.
👉 თითოეულ წყვილს შეგიძლია ჩართო/გამორთო ინდიკატორის პარამეტრებიდან.
👉 შესაძლებელია ფერების შეცვლა, ასევე სურვილის შემთხვევაში EMA-ების higher timeframe-ზე გამოტანა (მაგ. 1D EMA 4H გრაფიკზე).
ეს ინსტრუმენტი განსაკუთრებით გამოსადეგია:
ტრენდების დადგენისთვის
გრძელვადიანი და მოკლევადიანი გადაკვეთების შესადარებლად
საკუთარი სტრატეგიის ტესტირებისთვის
This indicator lets you plot and compare the most commonly used EMA pairs on a single chart:
EMA 9/21
EMA 20/50
EMA 50/200
EMA 100/200
plus a fully customizable user-defined EMA pair.
👉 Each pair can be toggled on/off from the settings.
👉 Colors are customizable, and you can optionally display EMAs from a higher timeframe (e.g., show Daily EMAs on a 4H chart).
This tool is especially useful for:
Trend confirmation
Comparing short-term vs. long-term crosses
Backtesting your own strategies

Daily EMAs (8, 21 & 50) with BandDescription:
This script plots the Daily EMAs (8, 21, and 50) on any intraday or higher timeframe chart. It provides a clear, multi-timeframe view of market trends by using daily exponential moving averages (EMAs) and a dynamic visual band. I use this on the major indexes to decide if I should be mostly longing or shorting assets.
-In addition to identifying the trend structure, the 8-Day EMA often serves as a key area where buyers or sellers may become active, depending on the market direction:
-In an uptrend, the 8 EMA can act as a dynamic support zone, where buyers tend to re-enter on pullbacks.
-In a downtrend, the same EMA may act as resistance, where sellers become more aggressive.
-The script also includes a colored band between the 8 and 21 EMAs to highlight the short-term trend bias:
-Green fill = 8 EMA is above the 21 EMA (bullish structure).
Blue fill = 8 EMA is below the 21 EMA (bearish structure).
The 50-Day EMA is included to give additional context for intermediate-term trend direction.
Features:
- Daily EMA levels (8, 21, and 50) calculated regardless of current chart timeframe.
- 8 EMA acts as a potential buyer/seller zone based on trend direction.
- Color-coded band between 8 and 21 EMAs:
- Green = Bullish short-term bias
- Blue = Bearish short-term bias
- Customizable price source and EMA offset.
- Suitable for trend trading, pullback entries, and higher-timeframe confirmation.
Use Cases:
Identify key dynamic support/resistance areas using the 8 EMA.
Assess short-, medium-, and intermediate-term trend structure at a glance.
Enhance confluence for entry/exit signals on lower timeframes.

Normalized EMA Cycle (NEC)Normalized EMA Cycle (NEC)
The Normalized EMA Cycle (NEC) is a versatile momentum and trend reversal tool designed to detect high-probability turning points and gauge the strength of price cycles.
It combines fast and slow Exponential Moving Averages (EMAs), dynamic normalization, and adaptive transparency to create clear, intuitive reversal signals on the chart.
🔹 How It Works
EMA Differencing
The NEC calculates the difference between a fast EMA and a slower EMA:
Fast EMA Length (default 6) captures short-term momentum.
Slow EMA Length (default 16) tracks broader trends.
The slope of this difference identifies accelerating or decelerating momentum.
Normalization to 0–100 Scale
The raw EMA difference is scaled relative to the recent Alpha Period range (default 6 bars).
This transforms the value into a normalized oscillator ranging between 0 and 100.
A 3-period Hull Moving Average (HMA) smooths this series to reduce noise.
Overbought and Oversold Thresholds
By default:
Overbought Level: 75
Oversold Level: 25
Crossovers of these levels are used to detect potential reversals.
Adaptive Alpha Adjustment
The normalized value is transformed into an “Alpha Schaff” line, dynamically shifting between price and normalized cycles.
This helps the model adjust to different volatility regimes.
Trend Reversal Logic
Bullish Reversal:
Normalized oscillator crosses above the Oversold Level.
EMA difference slope is positive.
Bearish Reversal:
Normalized oscillator crosses below the Overbought Level.
EMA difference slope is negative.
Additional confirmation comes when price crosses the Alpha Schaff line in the direction of momentum.
Dynamic Confidence Visualization
The indicator calculates a trend confidence score based on the normalized separation of the EMAs.
The transparency of reversal markers dynamically adjusts:
Strong trends = more opaque signals
Weak trends = more transparent signals
🔹 How to Use
✅ Entries
Long Signal: Aqua upward label appears below a bar.
Conditions:
Bullish reversal or price crossing above Alpha Schaff
Normalized slope is rising
Short Signal: Fuchsia downward label appears above a bar.
Conditions:
Bearish reversal or price crossing below Alpha Schaff
Normalized slope is falling
✅ Trend Strength
The less transparent the signal marker, the more significant the trend.
✅ Customization
Use the inputs to fine-tune sensitivity:
Shorter EMAs: Faster signals
Longer EMAs: Smoother trends
Alpha Period: Adjusts the lookback range for normalization
🟢 Best Practices
NEC is best used in combination with other trend confirmation tools (e.g., price structure, volume, or higher timeframe EMAs).
Avoid relying on signals in extremely low-volume or choppy ranges.
⚠️ Disclaimer
This script is intended for educational purposes only and does not constitute financial advice. Trading involves substantial risk, and you should consult your financial advisor before making any investment decisions.

EMA 200 Monitor - Bybit CoinsEMA 200 Monitor - Bybit Coins
📊 OVERVIEW
The EMA 200 Monitor - Bybit Coins is an advanced indicator that automatically monitors 30 of the top cryptocurrencies traded on Bybit, alerting you when they are close to the 200-period Exponential Moving Average on the 4-hour timeframe.
This indicator was developed especially for traders who use the EMA 200 as a key support/resistance level in their swing trading and position trading strategies.
🎯 WHAT IT'S FOR
Multi-Asset Monitoring: Simultaneous monitoring of 30 cryptocurrencies without having to switch between charts
Opportunity Identification: Detects when coins are approaching the 200 EMA, a crucial technical level
Automated Alerts: Real-time notifications when a coin reaches the configured proximity
Time Efficiency: Eliminates the need to manually check chart collections
⚙️ HOW IT WORKS
Main Functionality
The indicator uses the request.security() function to fetch price data and calculate the 200 EMA of each monitored asset. With each new bar, the script:
Calculates the distance between the current price and the 200 EMA for each coin
Identifies proximity based on the configured percentage (default: 2%)
Displays results in a table organized on the chart
Generates automatic alerts when proximity is detected
Monitored Coins
Major : BTC, ETH, BNB, ADA, XRP, SOL, DOT, DOGE, AVAX
DeFi : UNI, LINK, ATOM, ICP, NEAR, OP, ARB, INJ
Memecoins : SHIB, PEPE, WIF, BONK, FLOKI
Emerging : SUI, TON, APT, POL (ex-MATIC)
📋 AVAILABLE SETTINGS
Adjustable Parameters
EMA Length (Default: 200): Exponential Moving Average Period
Proximity Percentage (Default: 2%): Distance in percentage to consider "close"
Show Table (Default: Active): Show/hide results table
Table Position: Position of the table on the chart (9 options available)
Color System
🔴 Red: Distance ≤ 1% (very close)
🟠 Orange: Distance ≤ 1.5% (close)
🟡 Yellow: Distance ≤ 2% (approaching)
🚀 HOW TO USE
Initial Configuration
Add the indicator to the 4-hour timeframe chart
Set the parameters according to your strategy
Position the table where there is no graphic preference
Setting Alerts
Click "Create Alert" in TradingView
Select the "EMA 200 Monitor" indicator
Set the notification frequency and method
Activate the alert to receive automatic notifications
Results Interpretation
The table shows:
Coin: Asset name (e.g. BTC, ETH)
Price: Current currency quote
EMA 200: Current value of the moving average
Distance: Percentage of proximity to the core code
💡 STRATEGIES TO USE
Reversal Trading
Entry: When price touches or approaches the EMA 200
Stop: Below/above the EMA with a safety margin
Target: Previous resistance/support levels
Breakout Trading
Monitoring: Watch for currencies consolidating near the EMA 200
Entry: When the media is finally broken
Confirmation: Volume and close above/below the EMA
Swing Trading
Identification: Use the monitor to detect setups in formation
Timing: Wait for the EMA 200 to approach for detailed analysis
Management: Use the EMA as a reference for stops dynamics
⚠️ IMPORTANT CONSIDERATIONS
Technical Limitations
Request Bybit data: Access to exchange symbols required
Specific timeframe: Optimized for 4-hour analysis
Minimum delay: Data updated with each new bar
Usage Recommendations
Combine with technical analysis: Use together with other indicators
Confirm the configuration: Check the graphic patterns before trading
Manage risk: Always use stop loss and adequate position sizing
Backtesting: Test your strategy before applying with real capital
Disclaimer
This indicator is a technical analysis tool and does not constitute investment advice. Always do your own analysis and manage detailed information about the risks of your operations.
🔧 TECHNICAL INFORMATION
Pine Script version: v6
Type: Indicator (overlay=true)
Compatibility: All TradingView plans
Resources used: request.security(), arrays, tables
Performance: Optimized for multiple simultaneous queries
📈 COMPETITIVE ADVANTAGES
✅ Simultaneous monitoring of 30 major assets ✅ Clear visual interface with intuitive core system ✅ Customizable alerts for different details ✅ Optimized code for maximum performance ✅ Flexible configuration adaptable to different strategies ✅ Real-time update without the need for manual refresh
Developed for traders who value efficiency and accuracy in identifying market opportunities based on the EMA 20

HiLo EMA Custom bandsHILo Ema custom bands
This advanced technical indicator is a powerful variation of "HiLo Ema squeeze bands" that combines the best elements of Donchian channels and EMAs. It's specially designed to identify price squeezes before significant market moves while providing dynamic support/resistance levels and predictive price targets.
Indicator Concept:
The indicator initializes EMAs at each new high or low - the upper EMA tracks highs while the lower EMA tracks lows. It draws maximum of 6 custom bands based on percentage, fixed value or Atr
Upper EM bands are drawn below uper ema, Lower EMA bands are drawn above lower ema
Customizable Options:
Ema length: 200 default
Calculation type: Ema (Default), HILO
Calculation type: Percent,Fixed Value, ATR
Band Value: Percent/Value/ATR multiple This is value to use for calculation type
Band Selection: Both,Upper,Lower
Key Features:
You can choose to draw either of one or both, the latter can be overwhelming initially but as you get used to it, it becomes a powerful tool.
When both bands are selected, upper and lower bands provide provides dual references and intersections
This creates a more trend-responsive alternative to traditional Donchian channels with clearly defined zones for trade planning.
If you select percaentage, note that the calulation is based FROM the respective EMA bands. So bands from lower EMA band will appear narrower compared to the those drawn from upper EMA band
Price targets or reversals:
Look of alignment of lines and price. The current level of one order could align with that of previous level of a different order because often markets move in steps
Settings Guide:
Recommended Settings:
Ema length: 200
Use one of the bands (not both) if using large length of say 1000
Calculation type: EMA
HILO will draw donchian like bands, this is useful if you only want flat price levels. In a rising market use upper and vise versa
Calculation type:
percentage for indices : 5, for symbols 10 or higher based on symbol volatility
Fixed value: about 10% of symbol value converted to value
Atr: 2 ideally
Perfect for swing traders and position traders looking for a more sophisticated volatility-based overlay that adapts to changing market conditions and provides predictive reversal levels.
Note: This indicator works well across multiple timeframes but is especially effective on H4, Daily and Weekly charts for trend trading.

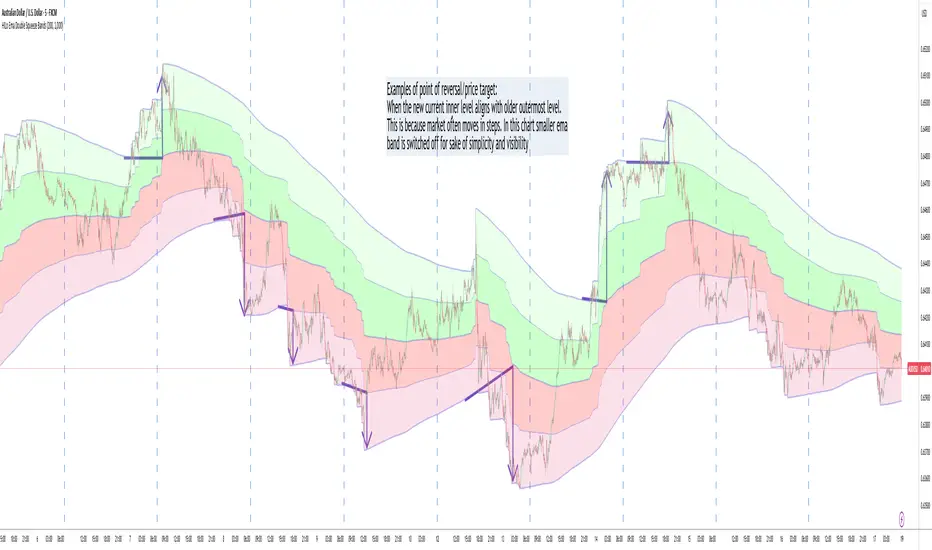
HILo Ema Double Squeeze BandsHILo Ema Double Squeeze Bands
This advanced technical indicator is a powerful variation of "HiLo Ema squeeze bands" that combines the best elements of Donchian channels and EMAs. It's specially designed to identify price squeezes before significant market moves while providing dynamic support/resistance levels and predictive price targets.
Indicator Concept:
The indicator initializes EMAs at each new high or low - the upper EMA tracks highs while the lower EMA tracks lows. The price range between upper and lower bands is divided into 4 equal zones by these lines:
Upper2 (uppermost line)
Upper1 (upper quartile)
Middle (center line)
Lower1 (lower quartile)
Lower2 (lowermost line)
This creates a more trend-responsive alternative to traditional Donchian channels with clearly defined zones for trade planning.
Key Features:
Dual EMA Band System: Utilizes both short-term and long-term EMAs to create adaptive price channels that respond to different market cycles
Quartile Divisions: Each band set includes middle lines and quartile divisions for more precise entry and exit points
Customizable Parameters: Easily adjust EMA periods and display options to suit your trading style and timeframe
Visual Color Zones: Clear color-coded zones help quickly identify bullish and bearish areas
Optional Extra Divisions: Add more granular internal lines (eighth divisions) for enhanced precision with longer EMA periods
Price Labels Option: Display exact price values for key levels directly on the chart
Price Target Prediction:
One of the most valuable features of this indicator is its ability to help predict potential reversal points:
When price breaks above the Upper2 level, look for potential reversals when the new Upper1 or Middle line aligns with previous Upper2 levels
When price breaks below the Lower2 level, look for potential reversals when the new Lower1 or Middle line aligns with previous Lower2 levels
Settings Guide:
Recommended Settings: 200 for Short EMA, 1000 for Long EMA works extremely well across most timeframes and symbols
Display options allow you to show/hide either band system based on your analysis preferences
The new option to divide the long EMA range into 8 parts instead of 4 is particularly useful when:
Long EMA period is >500
Short EMA is switched off and long EMA is used independently
Perfect for swing traders and position traders looking for a more sophisticated volatility-based overlay that adapts to changing market conditions and provides predictive reversal levels.
Note: This indicator works well across multiple timeframes but is especially effective on H4, Daily and Weekly charts for trend trading.
EMA Scalping StrategyEMA Slope Indicator Overview:
The indicator plots two exponential moving averages (EMAs) on the chart: a 9-period EMA and a 15-period EMA.
It visually represents the EMAs on the chart and highlights instances where the slope of each EMA exceeds a certain threshold (approximately 30 degrees).
Scalping Strategy:
Using the EMA Slope Indicator on a 5-minute timeframe for scalping can be effective, but it requires adjustments to account for the shorter time horizon.
Trend Identification: Look for instances where the 9-period EMA is above the 15-period EMA. This indicates an uptrend. Conversely, if the 9-period EMA is below the 15-period EMA, it suggests a downtrend.
Slope Analysis: Pay attention to the slope of each EMA. When the slope of both EMAs is steep (exceeds 30 degrees), it signals a strong trend. This can be a favorable condition for scalping as it suggests potential momentum.
Entry Points:
For Long (Buy) Positions: Consider entering a long position when both EMAs are sloping upwards strongly (exceeding 30 degrees) and the 9-period EMA is above the 15-period EMA. Look for entry points when price retraces to the EMAs or when there's a bullish candlestick pattern.
For Short (Sell) Positions: Look for opportunities to enter short positions when both EMAs are sloping downwards strongly (exceeding -30 degrees) and the 9-period EMA is below the 15-period EMA. Similar to long positions, consider entering on retracements or bearish candlestick patterns.
Exit Strategy: Use tight stop-loss orders to manage risk, and aim for small, quick profits. Since scalping involves short-term trading, consider exiting positions when the momentum starts to weaken or when the price reaches a predetermined profit target.
Risk Management:
Scalping involves high-frequency trading with smaller profit targets, so it's crucial to implement strict risk management practices. This includes setting stop-loss orders to limit potential losses and not risking more than a small percentage of your trading capital on each trade.
Backtesting and Optimization:
Before implementing the strategy in live trading, backtest it on historical data to assess its performance under various market conditions. You may also consider optimizing the strategy parameters (e.g., EMA lengths) to maximize its effectiveness.
Continuous Monitoring:
Keep a close eye on market conditions and adjust your strategy accordingly. Market dynamics can change rapidly, so adaptability is key to successful scalping.

CCI+EMA Strategy with Percentage or ATR TP/SL [Alifer]This is a momentum strategy based on the Commodity Channel Index (CCI), with the aim of entering long trades in oversold conditions and short trades in overbought conditions.
Optionally, you can enable an Exponential Moving Average (EMA) to only allow trading in the direction of the larger trend. Please note that the strategy will not plot the EMA. If you want, for visual confirmation, you can add to the chart an Exponential Moving Average as a second indicator, with the same settings used in the strategy’s built-in EMA.
The strategy also allows you to set internal Stop Loss and Take Profit levels, with the option to choose between Percentage-based TP/SL or ATR-based TP/SL.
The strategy can be adapted to multiple assets and timeframes:
Pick an asset and a timeframe
Zoom back as far as possible to identify meaningful positive and negative peaks of the CCI
Set Overbought and Oversold at a rough average of the peaks you identified
Adjust TP/SL according to your risk management strategy
Like the strategy? Give it a boost!
Have any questions? Leave a comment or drop me a message.
CAUTIONARY WARNING
Please note that this is a complex trading strategy that involves several inputs and conditions. Before using it in live trading, it is highly recommended to thoroughly test it on historical data and use risk management techniques to safeguard your capital. After backtesting, it's also highly recommended to perform a first live test with a small amount. Additionally, it's essential to have a good understanding of the strategy's behavior and potential risks. Only risk what you can afford to lose .
USED INDICATORS
1 — COMMODITY CHANNEL INDEX (CCI)
The Commodity Channel Index (CCI) is a technical analysis indicator used to measure the momentum of an asset. It was developed by Donald Lambert and first published in Commodities magazine (now Futures) in 1980. Despite its name, the CCI can be used in any market and is not just for commodities. The CCI compares current price to average price over a specific time period. The indicator fluctuates above or below zero, moving into positive or negative territory. While most values, approximately 75%, fall between -100 and +100, about 25% of the values fall outside this range, indicating a lot of weakness or strength in the price movement.
The CCI was originally developed to spot long-term trend changes but has been adapted by traders for use on all markets or timeframes. Trading with multiple timeframes provides more buy or sell signals for active traders. Traders often use the CCI on the longer-term chart to establish the dominant trend and on the shorter-term chart to isolate pullbacks and generate trade signals.
CCI is calculated with the following formula:
(Typical Price - Simple Moving Average) / (0.015 x Mean Deviation)
Some trading strategies based on CCI can produce multiple false signals or losing trades when conditions turn choppy. Implementing a stop-loss strategy can help cap risk, and testing the CCI strategy for profitability on your market and timeframe is a worthy first step before initiating trades.
2 — AVERAGE TRUE RANGE (ATR)
The Average True Range (ATR) is a technical analysis indicator that measures market volatility by calculating the average range of price movements in a financial asset over a specific period of time. The ATR was developed by J. Welles Wilder Jr. and introduced in his book “New Concepts in Technical Trading Systems” in 1978.
The ATR is calculated by taking the average of the true range over a specified period. The true range is the greatest of the following:
The difference between the current high and the current low.
The difference between the previous close and the current high.
The difference between the previous close and the current low.
The ATR can be used to set stop-loss orders. One way to use ATR for stop-loss orders is to multiply the ATR by a factor (such as 2 or 3) and subtract it from the entry price for long positions or add it to the entry price for short positions. This can help traders set stop-loss orders that are more adaptive to market volatility.
3 — EXPONENTIAL MOVING AVERAGE (EMA)
The Exponential Moving Average (EMA) is a type of moving average (MA) that places a greater weight and significance on the most recent data points.
The EMA is calculated by taking the average of the true range over a specified period. The true range is the greatest of the following:
The difference between the current high and the current low.
The difference between the previous close and the current high.
The difference between the previous close and the current low.
The EMA can be used by traders to produce buy and sell signals based on crossovers and divergences from the historical average. Traders often use several different EMA lengths, such as 10-day, 50-day, and 200-day moving averages.
The formula for calculating EMA is as follows:
Compute the Simple Moving Average (SMA).
Calculate the multiplier for weighting the EMA.
Calculate the current EMA using the following formula:
EMA = Closing price x multiplier + EMA (previous day) x (1-multiplier)
STRATEGY EXPLANATION
1 — INPUTS AND PARAMETERS
The strategy uses the Commodity Channel Index (CCI) with additional options for an Exponential Moving Average (EMA), Take Profit (TP) and Stop Loss (SL).
length : The period length for the CCI calculation.
overbought : The overbought level for the CCI. When CCI crosses above this level, it may signal a potential short entry.
oversold : The oversold level for the CCI. When CCI crosses below this level, it may signal a potential long entry.
useEMA : A boolean input to enable or disable the use of Exponential Moving Average (EMA) as a filter for long and short entries.
emaLength : The period length for the EMA if it is used.
2 — CCI CALCULATION
The CCI indicator is calculated using the following formula:
(src - ma) / (0.015 * ta.dev(src, length))
src is the typical price (average of high, low, and close) and ma is the Simple Moving Average (SMA) of src over the specified length.
3 — EMA CALCULATION
If the useEMA option is enabled, an EMA is calculated with the given emaLength .
4 — TAKE PROFIT AND STOP LOSS METHODS
The strategy offers two methods for TP and SL calculations: percentage-based and ATR-based.
tpSlMethod_percentage : A boolean input to choose the percentage-based method.
tpSlMethod_atr : A boolean input to choose the ATR-based method.
5 — PERCENTAGE-BASED TP AND SL
If tpSlMethod_percentage is chosen, the strategy calculates the TP and SL levels based on a percentage of the average entry price.
tp_percentage : The percentage value for Take Profit.
sl_percentage : The percentage value for Stop Loss.
6 — ATR-BASED TP AND SL
If tpSlMethod_atr is chosen, the strategy calculates the TP and SL levels based on Average True Range (ATR).
atrLength : The period length for the ATR calculation.
atrMultiplier : A multiplier applied to the ATR to set the SL level.
riskRewardRatio : The risk-reward ratio used to calculate the TP level.
7 — ENTRY CONDITIONS
The strategy defines two conditions for entering long and short positions based on CCI and, optionally, EMA.
Long Entry: CCI crosses below the oversold level, and if useEMA is enabled, the closing price should be above the EMA.
Short Entry: CCI crosses above the overbought level, and if useEMA is enabled, the closing price should be below the EMA.
8 — TP AND SL LEVELS
The strategy calculates the TP and SL levels based on the chosen method and updates them dynamically.
For the percentage-based method, the TP and SL levels are calculated as a percentage of the average entry price.
For the ATR-based method, the TP and SL levels are calculated using the ATR value and the specified multipliers.
9 — EXIT CONDITIONS
The strategy defines exit conditions for both long and short positions.
If there is a long position, it will be closed either at TP or SL levels based on the chosen method.
If there is a short position, it will be closed either at TP or SL levels based on the chosen method.
Additionally, positions will be closed if CCI crosses back above oversold in long positions or below overbought in short positions.
10 — PLOTTING
The script plots the CCI line along with overbought and oversold levels as horizontal lines.
The CCI line is colored red when above the overbought level, green when below the oversold level, and white otherwise.
The shaded region between the overbought and oversold levels is plotted as well.

Ultimate Moving Averages (SMA & EMA)Welcome to the Ultimate Moving Average indicator.
Never again spend time looking for EMA / SMA indicators when you can have them all in this single indicator.
Options include :
Daily Chart: Classic Golden / Death Cross - 50/D and 200/D SMA
Daily Chart: 3-day Golden / Death Cross - 150/D and 600/D SMA
Daily Chart: 140/D SMA
Daily Chart: 700/D SMA
Daily Chart: 1458/D SMA
Daily Chart: Golden Ratio Multiplier
Any Chart: Scalping
9 SMA
10 SMA
20 SMA
21 SMA
30 SMA
34 SMA
50 SMA
80 SMA
100 SMA
200 SMA
8 EMA
10 EMA
13 EMA
20 EMA
21 EMA
26 EMA
30 EMA
34 EMA
50 EMA
55 EMA
80 EMA
89 EMA
100 EMA
200 EMA

Multi-EMAMulti-EMA Indicator
This script plots five commonly used Exponential Moving Averages (EMAs) on your chart for trend identification and trade timing.
Included EMAs & Colors:
EMA 8 — Red
EMA 20 — Orange
EMA 50 — Yellow
EMA 100 — Cyan
EMA 200 — Blue
How to use:
Shorter EMAs (8 & 20) help identify short-term momentum and potential entry/exit points.
Mid-range EMA (50) gives a broader view of intermediate trends.
Longer EMAs (100 & 200) are used to confirm long-term trend direction and key support/resistance zones.
Crossovers between EMAs can signal potential trend changes.
Price trading above most EMAs often signals bullish conditions, while trading below suggests bearish momentum.
Designed to work on any timeframe or market.

Moving Average Exponential (Daily Frozen EMA)This script plots an Exponential Moving Average (EMA) based on the daily timeframe, but with a unique twist:
✅ The EMA value is frozen for the entire current daily session, only updating when a new daily candle begins.
🔍 How it works:
The EMA is calculated using the 1-day timeframe, regardless of the chart's current timeframe.
This EMA value remains fixed throughout the day — it doesn't fluctuate intrabar.
It updates only once the daily candle has closed, providing a stable and reliable reference point during the trading day.
The default is the 5 day EMA but can be changed to any EMA timeframe you desire such as 9, 21, 50, 100. 200, etc.
✨ Additional Features:
✅ Optional smoothing with various moving average types (SMA, EMA, WMA, SMMA, VWMA).
✅ Optional Bollinger Bands on top of the smoothed EMA.
✅ Adjustable settings for EMA length, smoothing type, Bollinger Band deviation, and display options.
🛠️ Use Cases:
Ideal for traders who want a non-reactive EMA during intraday trading.
Helps reduce signal noise by anchoring EMA to higher timeframe structure.
Useful for strategy development where EMA should represent confirmed daily bias only.
Hope this helps, happy trading!

Bollinger Bands + EMA 200 + EMA 50This indicator combines three technical analysis tools: the Bollinger Bands (BB), and two Exponential Moving Averages (EMA) with periods of 200 and 50.
Bollinger Bands (BB): This indicator consists of three lines—the middle line being a simple moving average (SMA), and the upper and lower bands representing two standard deviations above and below the SMA. The width of the bands indicates market volatility, with wider bands signifying higher volatility and narrower bands indicating lower volatility.
Exponential Moving Averages (EMA 200 and EMA 50): The EMA is a type of moving average that gives more weight to recent prices, making it more responsive to price changes than the simple moving average. The EMA 200 is considered a long-term trend indicator, often used to identify the overall direction of the market. The EMA 50 is a medium-term trend indicator, helping to spot more immediate market trends. Crossovers between these two EMAs (such as when EMA 50 crosses above EMA 200) are commonly used as buy or sell signals, with the idea that a short-term trend shift is occurring.
By combining these three indicators, this custom Pine Script aims to give a comprehensive view of the market conditions, helping traders to understand both the volatility (via BB), the long-term market trend (via EMA 200), and the medium-term trend (via EMA 50). The interaction between the price and these indicators, along with crossovers, can be used to identify potential entry and exit points.

200 EMA AlertHow It Works:
The 200 EMA calculates the average price over the last 200 periods, giving more weight to recent price movements for a smoother and more responsive trend line.
It helps traders determine whether the market is in a bullish (above 200 EMA) or bearish (below 200 EMA) phase.
Why Traders Use the 200 EMA:
✅ Trend Confirmation – If the price is above the 200 EMA, the trend is bullish; if below, the trend is bearish.
✅ Dynamic Support & Resistance – Price often reacts around the 200 EMA, making it a key level for entries and exits.
✅ Works on All Timeframes – Whether on the 1-minute chart or the daily timeframe, the 200 EMA is effective for scalping, swing trading, and long-term investing.
✅ Easy to Combine with Other Indicators – Traders pair it with RSI, MACD, or price action for stronger confirmation.
How to Use It in Trading:
📌 Trend Trading – Buy when price pulls back to the 200 EMA in an uptrend; sell when price retests it in a downtrend.
📌 Breakout Strategy – A strong candle breaking above/below the 200 EMA signals a possible trend reversal.
📌 Filtering Trades – Many traders only take long trades above and short trades below the 200 EMA to align with the overall market trend.
Conclusion:
The 200 EMA is an essential indicator for traders of all levels, offering clear trend direction, strong support/resistance zones, and trade filtering for better decision-making. Whether you're trading forex, stocks, or crypto, mastering the 200 EMA can give you a significant edge in the markets. 🚀📈

Moneyball EMA-MACD indicator [VinnieTheFish]Summary of the Moneyball EMA-MACD Indicator Script
Author: VinnieTheFish
Purpose:
This indicator helps traders identify trend direction, momentum shifts, and potential trade signals based on EMA and MACD crossovers.
This Pine Script is a custom indicator that combines Exponential Moving Averages (EMAs) and MACD (Moving Average Convergence Divergence) to analyze price trends and momentum. The script uses a custom 9/50 MACD with a 16 smoothing period. The script is written in a way that you can create your own custom MACD settings and create alerts based on those parameters. The chart bars are color coded based on the relative position of the MACD and Signal line primarily for bullish long trade setups.
Bar color coding helps the trader spot potential reversals based on where the price currently resides in relation to the custom 9/50 EMA based MACD and the 16 period smoothing period for the signal line. Indicator also has custom alerts to notify the trader when a potential trade setup exists that correspond with the bar color change.
Question: So why is this called the Moneywell EMA-MACD Indicator?
Answer: In the movie Moneyball the Oakland A's broke down how to win a championship based on data. To make the playoffs you needed so many wins, then broken down by runs and then broken down to base hits. A base hit was good as a walk. With trading often times we look too often for home runs and ignore the importance of getting on base with small wins. This indicator was designed on shorter timeframes to identify those base hits, but can also be adapted to higher timeframes for swing trading.
Key Features:
User Inputs:
Configurable fast and slow lengths for MACD calculation.
Choice between SMA and EMA for oscillator and signal line smoothing.
Customizable signal smoothing length.
EMA Calculation:
Computes 3 EMA, 9 EMA, 20 EMA, and 50 EMA to track short-term and long-term trends.
MACD Calculation:
Computes MACD using either SMA or EMA based on user selection.
Generates the MACD signal line for comparison.
Crossover Conditions:
Detects MACD and Signal line crossovers above and below the zero line.
Identifies price momentum shifts.
Bar Coloring Logic:
Green: MACD is above 0 and above the signal line.
White: MACD is below the signal line.
Orange: MACD is below 0 but above the signal line.
Fuchsia: Bullish EMA 3/9 cross but price is still below the 20/50 EMA.
Alerts for Key Trading Signals:
MACD crossing above/below the zero line.
Signal line crossing above/below the zero line.
MACD reaching new highs/lows.
Alerts for colored bar conditions.

Turtle Trade Channels Indicator with EMATurtle Trade Channels Indicator with EMA (TuTCI + EMA)
This custom indicator combines the classic Turtle Trading Channel strategy with an Exponential Moving Average (EMA) filter to provide clear entry and exit signals, as well as trend direction guidance.
Features:
Turtle Channels: The indicator calculates the upper and lower Turtle Trading Channels based on the highest and lowest values over a user-defined period ( Entry Length for the channel).
Entry/Exit Signals: Alerts you to potential buy and sell opportunities with visual signals on the chart.
Long Entry: When the price crosses above the upper channel.
Short Entry: When the price crosses below the lower channel.
Long Exit: When the price breaks below the exit line.
Short Exit: When the price breaks above the exit line.
EMA Filter: A 50-period Exponential Moving Average (EMA) is included to identify the overall trend. The background color turns green when the price is above the EMA (bullish trend) and red when the price is below the EMA (bearish trend).
Highlighter: Optional background highlighting for the most relevant signals, such as when the price crosses the upper or lower Turtle Channel. This feature helps to easily identify key market movements.
Visual Customization: Customize the EMA length, Entry/Exit lengths, and toggle signals and highlighting to suit your preferences.
How It Works:
The Turtle Trade Channels are designed to capture breakouts by identifying key price levels (highest high and lowest low) over a specified period. By combining this strategy with an EMA, the indicator ensures trades are aligned with the broader trend, increasing the probability of successful trades.
Uptrend: When the price is above the EMA, the indicator considers the trend to be bullish, and it highlights long entry signals.
Downtrend: When the price is below the EMA, the trend is considered bearish, and short entries are emphasized.
Customization:
Entry Length: Adjusts the period for calculating the Turtle Channel's entry levels.
Exit Length: Defines the period for calculating the exit levels.
EMA Length: The period for the Exponential Moving Average (default is set to 50).
Show Entry/Exit Signals: Toggle the visibility of entry/exit signals on the chart.
Highlighter On/Off: Toggle background highlighting for key signals.
This indicator is suitable for traders who follow trend-following strategies, particularly those influenced by the Turtle Trading methodology, and wish to use an EMA filter for better trend confirmation.
Use Cases:
Trend-following traders looking for clear entry/exit signals.
Breakout traders using the Turtle Trading concept to identify price breakouts.
Swing traders who want to incorporate trend analysis with price levels.

HTF Dynamic EMA Smoothing Indicator [CHE] with Kernel SelectionThe Dynamic EMA Smoothing Indicator with Kernel Selection is a powerful Pine Script indicator for TradingView designed to smooth moving averages and identify market trends more clearly. Here is a detailed description of its functionalities and settings:
Main Functions:
1. Time Period Display:
- Option to show or hide an info box displaying the current time period.
- Customizable info box: Users can adjust the size, position, and colors of the info box to suit their preferences.
2. Timeframe Type Selection:
- Auto Timeframe: Automatically calculates the best timeframe based on the current resolution.
- Multiplier: Allows using an alternate timeframe as a multiple of the current resolution.
- Manual Resolution: Users can manually set a specific timeframe.
3. Colors:
- Custom colors for various graphical elements, including EMA lines and signals.
4. Basic Settings:
- EMA and Signal Periods: Defines the periods for the exponential moving averages (EMA) and signal lines.
- Smoothing Length and Kernel Type: Allows selecting the smoothing length and the type of kernel used for weighting the EMAs.
- ATR Multiplier: Defines the multiplier for the ATR (Average True Range) to identify relevant price ranges.
5. EMA Calculations:
- The indicator calculates a weighted EMA using several methods like Linear, Exponential, Epanechnikov, Triangular, and Cosine kernels.
- Smoothing is achieved by adding and removing values in a float array that stores the EMA values.
6. Plotting EMA and Signal Lines:
- The indicator plots the smoothed EMA and signal lines on the chart. The line colors change according to the trend direction (green for uptrend, red for downtrend).
7. Trading Signals:
- Long Signals: An upward arrow is displayed when the smoothed EMA indicates an uptrend.
- Short Signals: A downward arrow is displayed when the smoothed EMA indicates a downtrend.
- Alert Conditions: Alerts are triggered when long or short signals are detected.
8. ATR Bands:
- The indicator shows upper and lower ATR bands to identify potential support and resistance zones.
9. Time Period Display on Chart:
- A table is used to display the selected time period on the chart when the corresponding option is enabled.
This indicator offers extensive customization and allows traders to conduct complex market analyses using smoothed EMAs and custom timeframes. The integration of various kernels for smoothing makes it a versatile tool adaptable to different trading strategies.

EMA Trend Arrows Indicator### EMA Trend Arrows Indicator
**Description:**
The "EMA Trend Arrows Indicator" is designed to help traders identify bullish and bearish trends based on the Exponential Moving Average (EMA). This indicator plots arrows and lines on the chart, signaling potential trend changes, making it easier for users to spot entry and exit points in their trades.
**Indicator Features:**
1. **EMA Calculation:**
- The indicator calculates the Exponential Moving Average (EMA) over a user-defined period (`Length`).
- The default length is set to 50 periods but can be adjusted to suit different trading strategies.
2. **Trend Detection:**
- The indicator detects bullish trends when the EMA is falling for a specified duration (`Trend Duration`) and then starts rising.
- Conversely, it detects bearish trends when the EMA is rising for a specified duration and then starts falling.
- The default trend duration is set to 20 periods.
3. **Visual Signals:**
- **Bullish Signal:** When a bullish trend is detected, the indicator plots a blue upward arrow (▲) above the bar where the trend change is identified.
- **Bearish Signal:** When a bearish trend is detected, the indicator plots a red downward arrow (▼) below the bar where the trend change is identified.
- Additionally, lines are drawn to indicate the strength and duration of the trends. Blue lines represent bullish trends, while red lines represent bearish trends.
4. **Average True Range (ATR):**
- The indicator utilizes the Average True Range (ATR) to determine the placement of the lines and arrows, ensuring they are appropriately scaled to the price movements.
5. **EMA Plotting:**
- The EMA line is plotted on the chart in a grey color, allowing users to visualize the moving average alongside the trend signals.
6. **Chart Clarity:**
- To maintain a clear and uncluttered chart, the indicator automatically deletes past trend direction signals once a new trend is detected. This ensures that only the most relevant and current trend signals are displayed.
**User Inputs:**
- `Length`: Defines the period for EMA calculation. Default is 50.
- `Trend Duration`: Sets the duration to consider for trend changes. Default is 20.
- `Bullish`: Sets the color for bullish signals. Default is blue (#2962ff).
- `Bearish`: Sets the color for bearish signals. Default is red (#f23645).
- `MA`: Sets the color for the EMA line. Default is grey (#787b86).
**How to Use:**
- Add the "EMA Trend Arrows Indicator" to your chart.
- Configure the `Length` and `Trend Duration` based on your trading strategy.
- Observe the chart for blue upward arrows indicating potential buy signals and red downward arrows indicating potential sell signals.
- Use the plotted EMA line to gauge the overall market trend and make more informed trading decisions.
**Benefits:**
- Simplifies trend detection by providing clear visual signals.
- Helps traders identify potential entry and exit points.
- Customizable settings to fit various trading strategies.
- Maintains a clean chart by automatically removing outdated trend direction signals.
**Example:**
When applied to a daily chart, the indicator can help identify major trend reversals, providing traders with timely buy and sell signals. For instance, a blue arrow appearing after a period of EMA decline signals a potential buying opportunity as the trend shifts to bullish.
Add this indicator to your TradingView chart today to enhance your trend analysis and improve your trading performance.
Best regards Chervolino

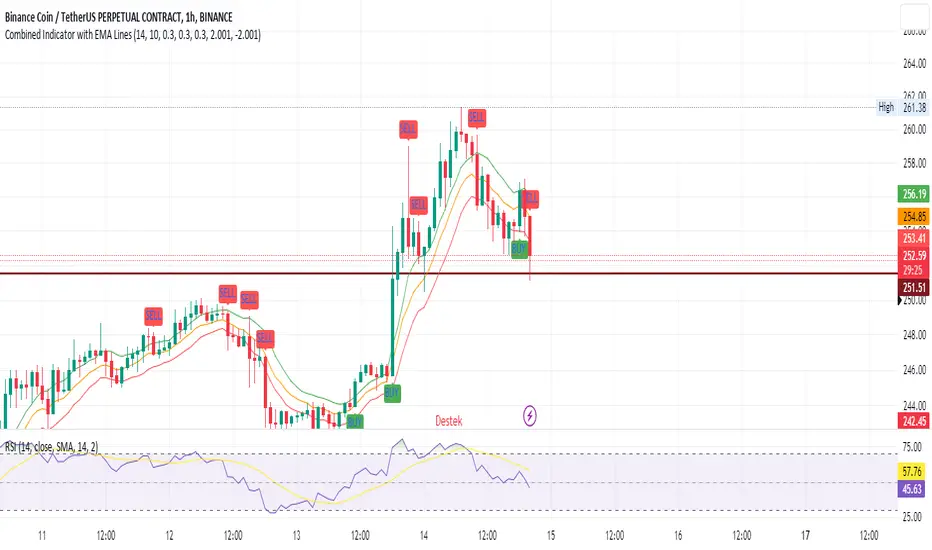
SEC-Combined Indicator with EMA LinesTitle: Combined Indicator with EMA Lines
Description:
The Combined Indicator with EMA Lines is a technical analysis tool that combines multiple indicators to provide insights into the market's strength and potential buying or selling opportunities. It incorporates the Relative Strength Index (RSI), Exponential Moving Average (EMA) lines, and the trend over the past three days to generate signals.
The indicator calculates a combined data value by assigning weights to the RSI, EMA, and past trend. The RSI measures the strength of price movements, while the EMA lines provide an indication of the average price over a specific period. The past trend considers the price behavior over the last three days. By combining these factors, the indicator offers a comprehensive view of market conditions.
Buy and sell signals are generated based on the change in the combined data. A buy signal occurs when there is an increase in the combined data above a specified threshold, indicating a potential buying opportunity. Conversely, a sell signal is triggered when there is a decrease in the combined data below a specified threshold, suggesting a potential selling opportunity.
The indicator also plots the EMA lines, which include the EMA High, EMA Average, and EMA Low. These lines provide additional visual cues about the price trend and potential support and resistance levels.
Traders can use the Combined Indicator with EMA Lines to identify potential entry and exit points in the market. It helps in capturing trends, evaluating price strength, and making informed trading decisions. The buy and sell signals, along with the EMA lines, aid in spotting potential reversals, confirming trends, and managing risk.
It's important to note that this indicator should be used in conjunction with other analysis techniques and risk management strategies. Traders should consider combining it with additional indicators, chart patterns, and fundamental analysis to enhance their trading decisions.
Remember to backtest and validate the indicator's performance using historical data before using it in real-time trading. Adjust the input parameters, such as RSI period, EMA period, and threshold values, to suit your trading style and market conditions.
Double EMA CROSS
Double EMA CROSS (DEC)
Useful for identifying and receiving alerts about uptrends and downtrends.
This script uses two Exponential Moving Averages (EMAs) to find price uptrends and downtrends.
An Exponential Moving Average ( EMA ) is a type of moving average that places a greater weight and significance on the most recent data points.
The script produces uptrend and downtrend signals based on crossovers and divergences between the two EMAs,
the user will be able to spot a trend change (when the EMAs crossover) and to determine the strength of the current trend (when the EMAs diverge).
It is also posible to get alerts for uptrends and downtrends on the web and mobile app with sound and pop-ups as well as via email.
The optimal time to enter and exit the market can be concluded from this trend changes.
The user can set their own EMAs, by default they are set to 25 and 75 periods for medium and long term respectively.
When the medium term EMA crosses below the long term EMA the asset is in a downtrend and the price will decline, and when the
medium term EMA crosses above the long term EMA the asset is in an uptrend and price will increase.
This scripts plots the following indicators and signals on the chart to help the user to identify trends:
1.- Medium and long term EMAs as lines overlaid on the price chart.
2.- Up green triangles above bars when the price is on an uptrend and down red triangles below bars when the price is on a downtrend.
3.- Arrows with text to indicate the start of an uptrend or downtrend.
The user can enable and disable the indicators and signals as well as set colors and shapes to their liking.
This script also lets the user create alerts for uptrends and downtrends. To create a new alert using this script follow this instructions:
1.- Once you added this script to your chart, go to the alerts panel (right on web or bottom tool bar on the mobile app) and add a new alert (alarm clock icon with a plus sign).
2.- A modal window will open. On the “Condition” dropdown menu select “DEC”.
3.- On the next dropdown menu (right below the “Condition” one) you can select.
4.- Lastly you can set all the normal alert options and create the alert.

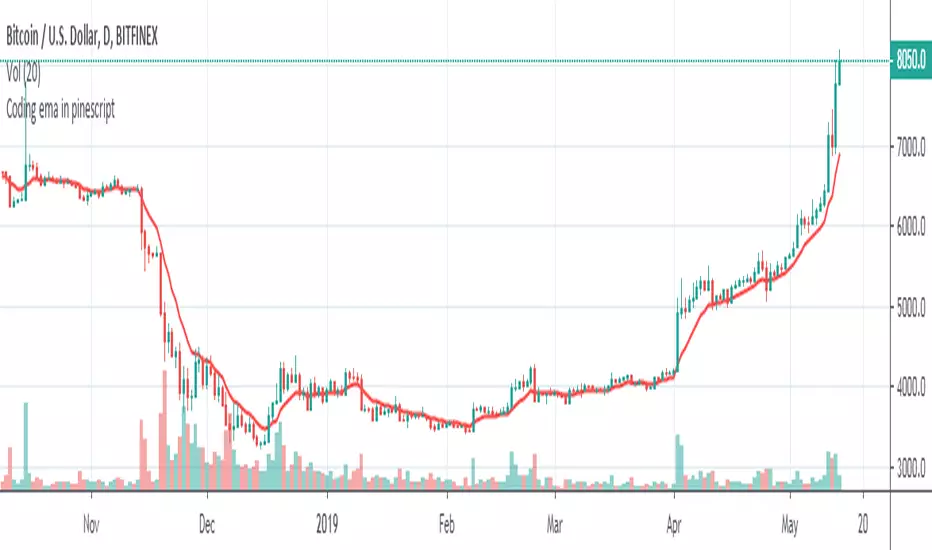
Coding ema in pinescriptWhat is EMA ?
Ema is known as exponential moving average, it comes from the class of weighted moving average. It gives more weightage to the recent price changes, thus making it much more relevant to the current market analysis. Also it provides a dynamic way of calculating support and resistances in a trend following setup.
The most common way to mint profit out from the market is to use trend following setups which can be easily achieved by using a group of EMA’s
So how’s this EMA calculated ?
Before understanding the calculation of EMA let’s look into a much wider topic:
“The Law of Averages”
It states : If you do something often enough a ratio will appear, simply put, any time series data, tend to deviate from its average.
EMA provides a way to statistically calculate the exponential moving average for a provided time series data giving much more emphasis on the most recent data in the series.
So in the 17th century, when the people were playing with numbers in their free time, they came up with a statistical strategy to envelop any time series data to detect the direction of the data flow , they called it exponential moving average.
Later in 1940’s with the increase in signal processing requirements in the field of electronic devices scientists started using Exponential moving average onto the electronic signal followers, just to classify the signals as above or below a moving/dynamic threshold.
So EMA is a smoothed time-series data.
The simplest form of EMA Smoothing can be given by the formula:
S(t) = alpha * X(t) + (1 - alpha) * X(t - 1).
The value of alpha must lie between 0 and 1
Where
alpha , is the smoothing factor
X(t) , is the current observation data point
X(t - 1), is the past observational data point.
t , is the current time
Generally,
In current day trading setups for EMA the alpha is calculated by
alpha = 2 / (time period window + 1)
Things to note here is that the alpha calculated above is the most generally used factor calculation method for EMA ,
You can tweak the alpha function above until it gives value between 0 and 1 for example alpha can also be written as
alpha = ln ( current price / past price )
Note it’s just a weighing scheme,
But for Our Case of EMA
We will be using
alpha = 2 / (time period window + 1)
Please refer to the script code below
Alper-EMAAlper-EMA
Description:
This indicator allows you to display 5 customizable EMAs (Exponential Moving Averages) on a single chart. Each EMA can be configured independently with length, color, visibility, and calculation timeframe.
Features:
5 fully customizable EMAs
Set individual length and color for each EMA
Toggle visibility for each EMA
Multi-timeframe calculation: e.g., display EMA300 calculated on a 30-minute timeframe while viewing a 1-minute chart
Labels display EMA period and timeframe for clarity
Adjustable label size: tiny / small / normal / large
Clear and readable plot lines
Use Cases:
Monitor multiple timeframe EMAs simultaneously
Analyze trend and support/resistance levels
Track EMA crossovers for strategy development
Note:
This indicator is suitable for both short-term (scalping) and medium-to-long term analysis. The multi-timeframe feature allows you to see different EMA perspectives on a single chart quickly.
